Quantitative Analysis for Brown University

Overview
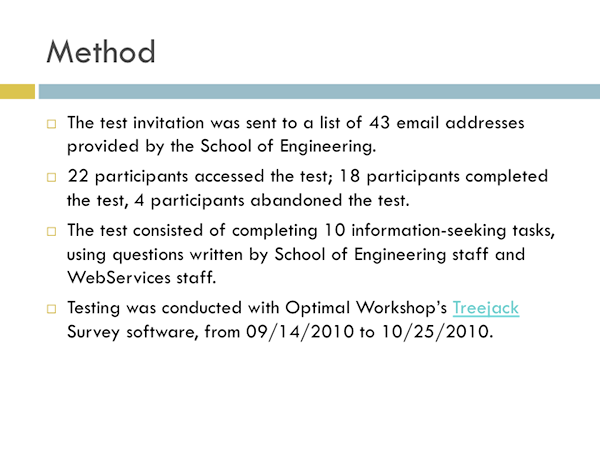
A few years ago I did some consulting work with the Web Services group at Brown University. One of the assignments included analyzing quantitative data from navigation feedback surveys in Treejack and recommending navigation and usability improvements.
Approach
For the Physics Department, I analyzed their raw server logs, summarized the data, and provided recommendations such as the following:
- Ignoring the months with incomplete data (January and November), there was a higher level of requests during the spring than the fall. Page requests went up, however, in the fall. A difference of 5% of requests between the spring and fall is significant, though there isn't enough data for hypothesizing a reason. A difference of .4% for page requests is less significant. The months with the highest number of requests were April, May, and March. The months with the highest number of page requests were May, September, and March. What are visitors seeking during these months of traffic spikes? Should new content or links to content appear on the homepage during these months?
- Out of about 23 million requests, 1.6 million requests (about 7%) failed due to a server error. 7% is a high enough rate that you may want to monitor future server errors.
- More than 75% percent of requests were for MP3 files, with more than 65% of requests made for one specific MP3 file (/physics/userpages/students/yyyyyy/all/mlxq.mp3), with requests made for the specific file as recently as November. If the files are not legitimate, you may have a filesharing problem on your hands. If the files are legitimate, you should consider different hosting configurations to balance the load of the demand. Computing & Information Services can help with that.
After analyzing the data, I recommended a simplified site navigation and an improved information architecture in several reports.
Here is a screenshot of the raw data:

Artifacts
I created several reports with the data analysis and recommendations. When the Web Services Director presented my recommendations to the Physics Department, he reported that they were quite happy with it and were planning to use it as their roadmap for building out their new site.
Here are a few screenshots from one of the reports:


What I learned
In this project I learned how to work with a lot of raw data like you find in server logs, how to use the user testing analysis tool Treejack, and more about the differences between quantitative testing and qualitative testing. At the time, I had done more qualitative testing than quantitative testing.